Introduction
IoT is one of the main frontier in technology today, it provides endless benefits by converting “dumb” devices into smarter and more efficient ones. It’s already a widely adopted concept and can be seen in many applications such as fitness trackers to cars to home security cameras. IoT, on one hand, enables “things” to “speak”, send out signals in real-time to “data consumers”, where the latter is responsible to fit, analyze and make a decision, an instant one, when needed.

One of the main challenging technical parts is finding means to handle devices output in real-time and act upon them. Sensors, for instance, are capable of sending very fast real-time “raw-data” which can to be analyzed and possibly stored somewhere to refer back to in the future for various purposes, such as training a Machine Learning algorithm. The complicated part here is having a technology that can accept a huge amount of fast-raw-data, analyze it and store it somewhere (cheap and reliable). Thankfully, we have another main frontier in technology today called big data which has many frameworks that help us to get the job done. But dealing with (engineering) raw-data is one part, the other, profitable, part is making the value of this raw-data, converting it into actionable insights that allow us to make instant, automated, decisions.
Use cases for IoT, to generate business value and improve productivity/efficiency, are endless. Geo-based marketing, devices monitoring (for failure, changing conditions, status, etc…), real-time recommendation, fraud detection, manufacturing and much more. In this blog, I’m going to give you a real-world example for “Oil & Gas” industry (could be water, or any liquid based product manufacturer actually) and show you how Oracle Stream Analytics can help you to deal with ultra fast real-time raw-data in many ways: from running sub-second pattern analysis (out-of-the-box), to making decisions/alerts based on certain business rules.
Oracle Stream Analytics
“The Oracle Stream Analytics, OSA, platform provides a compelling combination of an easy-to-use visual facade to rapidly create and dynamically change Real Time Event Stream Processing (Fast Data) applications, together with a comprehensive run-time platform to manage and execute these solutions. This tool is business user-friendly and solves the business dilemmas by completely hiding and abstracting the underlying technology platform.”
OSA can read/publish fast streaming data from/to Coherence Cache, MQTT, JMS, Event Generator, CSV, HTTP Subscriber, Kafka, EDN, REST and Twitter. Out of the box, zero-coding, with a very intuitive web-interface. Under the hood you may use Oracle Event Processing, OEP, infrastructure (embedded), or customize it to run on top of Spark for even more massive horizontal scaling.
The Use-Case
Scenario
An Oil and Gas company has fleet of trucks for distributing oil/gas to stations based on their need. Each station has tanks that have been equipped with sensors to scan oil level, humidity and temperature. Their fleet, also, have been equipped with GPS devices.

The company needs to fulfil their supply requests automatically once oil level at any of the stations’ tanks reach 15% or less. The company wants also to have analysis on the real-time data coming from sensors, understand any unpredicted change, correlations and have generic statistics in the form of “aggregations”. Moreover, their fleet needs to be monitored, geographically, and to send alerts to specific systems when they enter specific zones, such as stations, base, break-areas or restricted zones.
The Data and IoT Sensors
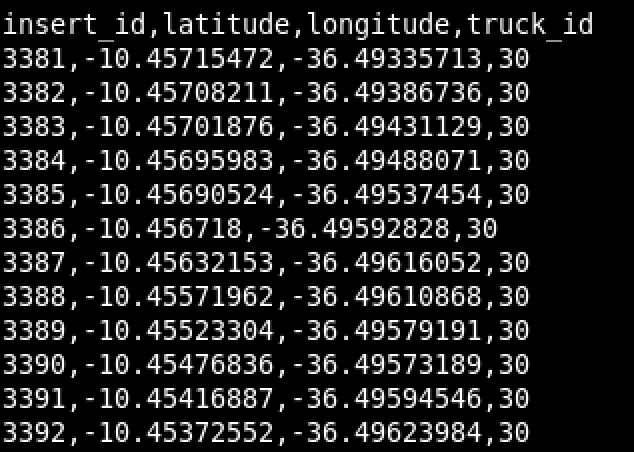
Distribution Trucks: Each truck stream out location based data (latitude and longitude). Sample data:
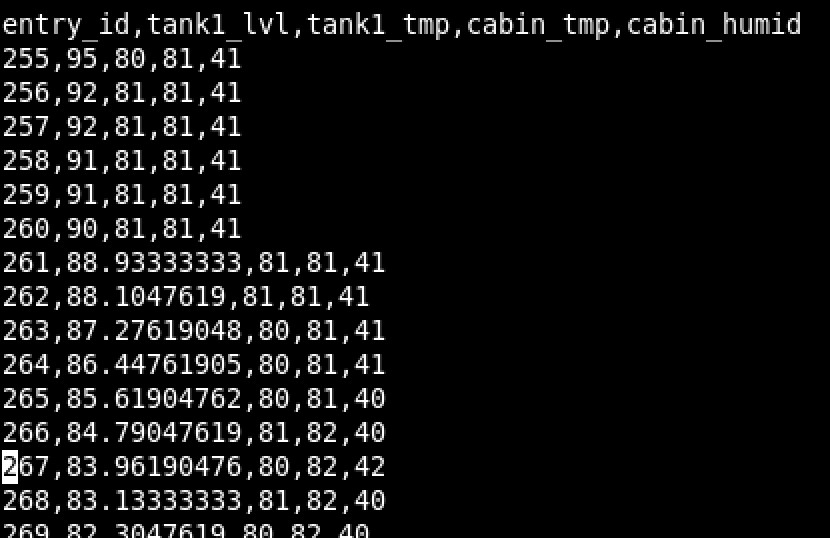
Stations: Each station has sensors installed on tanks to monitor tank level, tank temperature, cabin temperature and cabin humidity. Those are vital information not only to fulfil supply requests, but also to monitor the health of the tanks for safety and risk management reasons. Sample data:
Scope
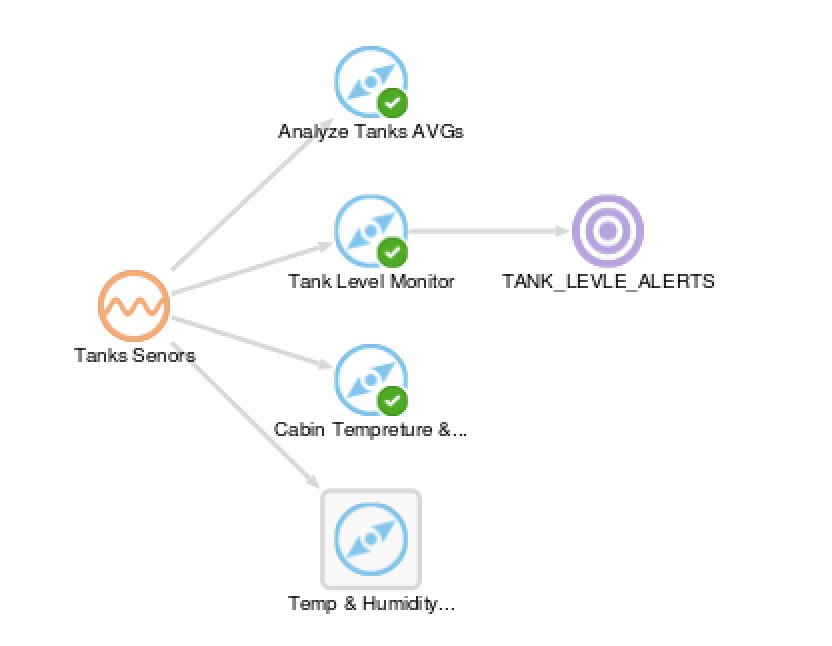
OSA has been configured to receive sensors’ raw data via streaming channels. To minimize the scope of this use-case demo, we’ll be looking only at one station output data and one truck output data. The data will be supplied, for demoing purposes, in the form of CSV file. In real-life, this could be Kafka, JMS, Oracle GoldenGate* or any other streaming channels which OSA supports.
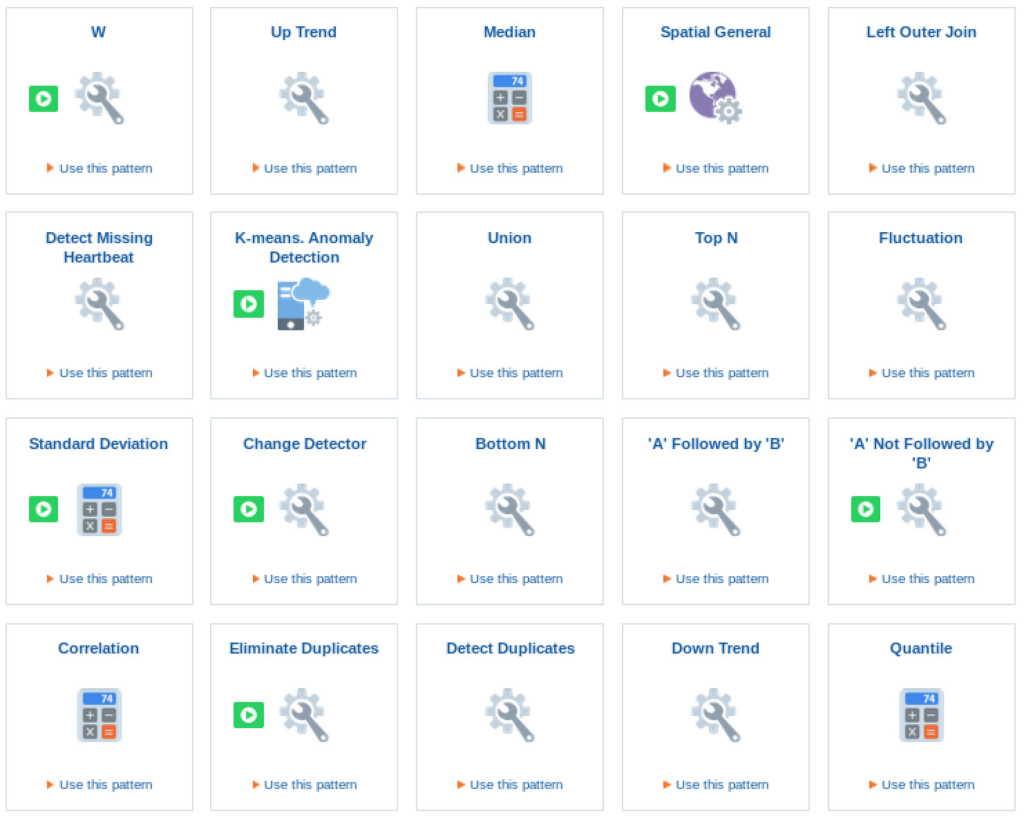
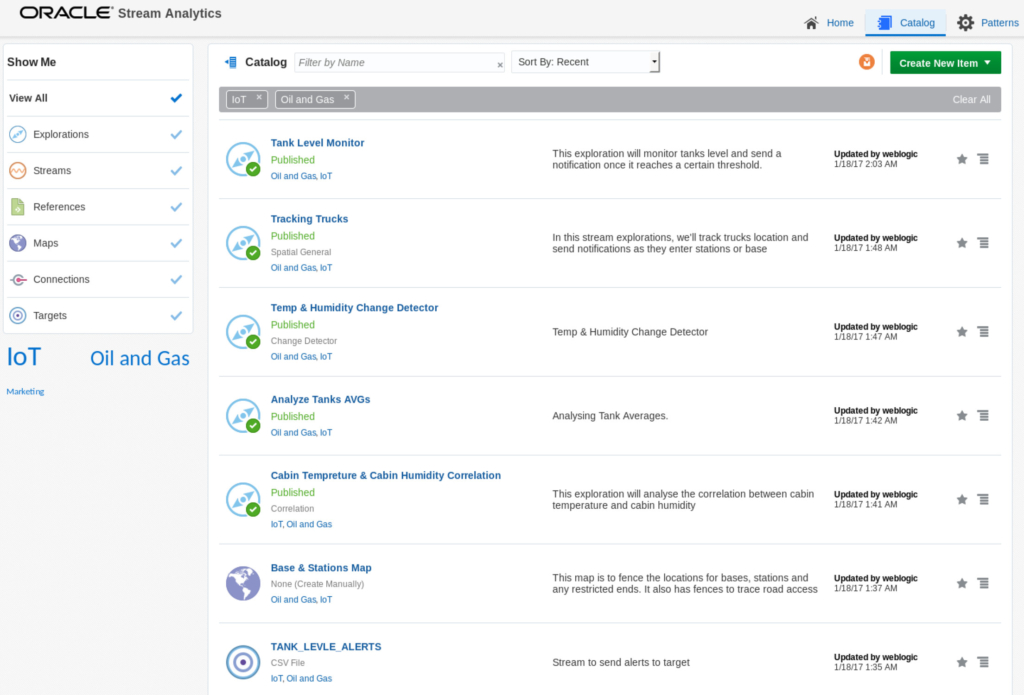
The demo also “fast-forward” the data income, to simulate a real-life input of many days. I’ve built the following explorations, analytics and patterns to demo the use-case:
Execution
Tank Level Monitoring & Alerting
This exploration monitors tank levels if it drops below 15% and send an alert to an external system. Once this alert is sent, one of the distribution trucks will receive a notification with information to fulfil the station needs (more on this later).
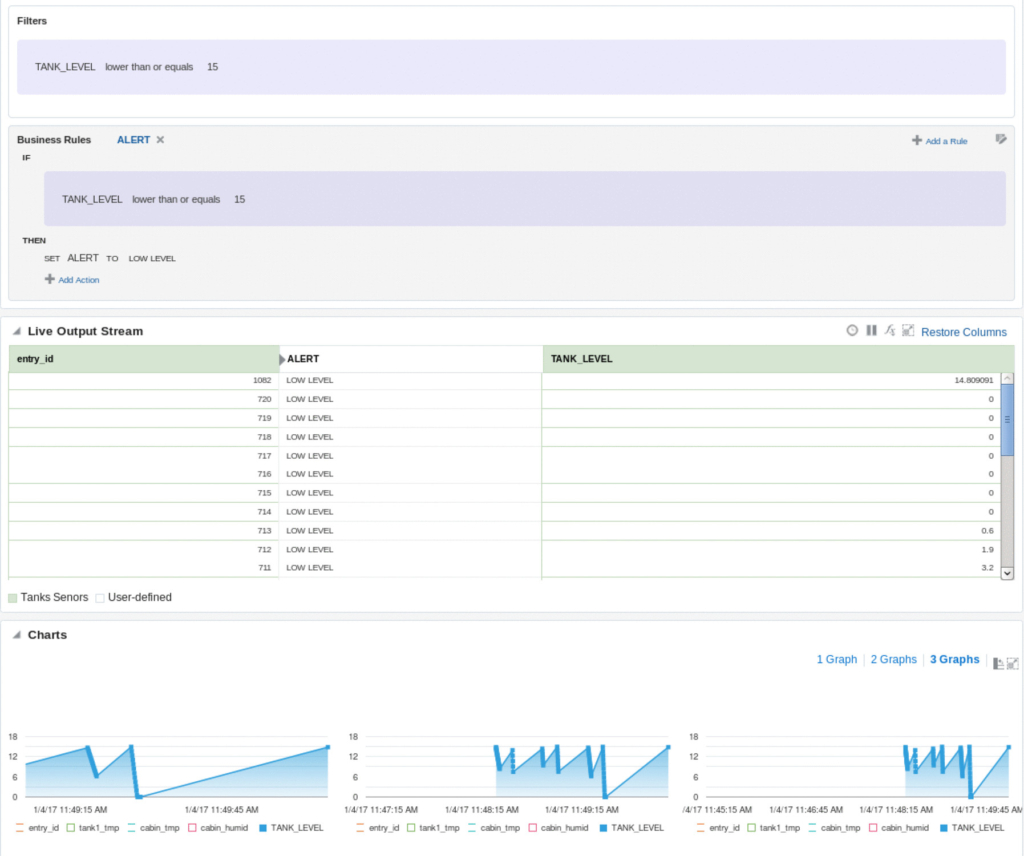
**Notice the filter and business rules.
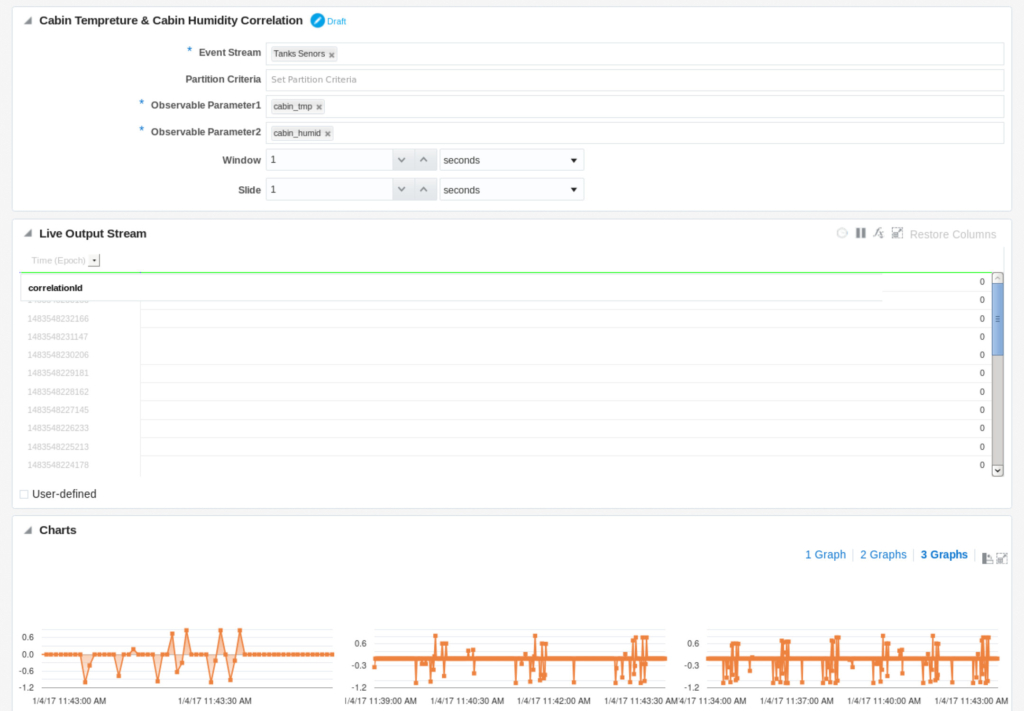
Cabin Temperature & Humidity Correlation
This pattern will analyze the fast streaming data in real-time to find if there is a correlation between cabin temperature and humidity. On the bottom, there are charts with different intervals: 1 minute, 2.5 minutes and 10 minutes (adjustable).
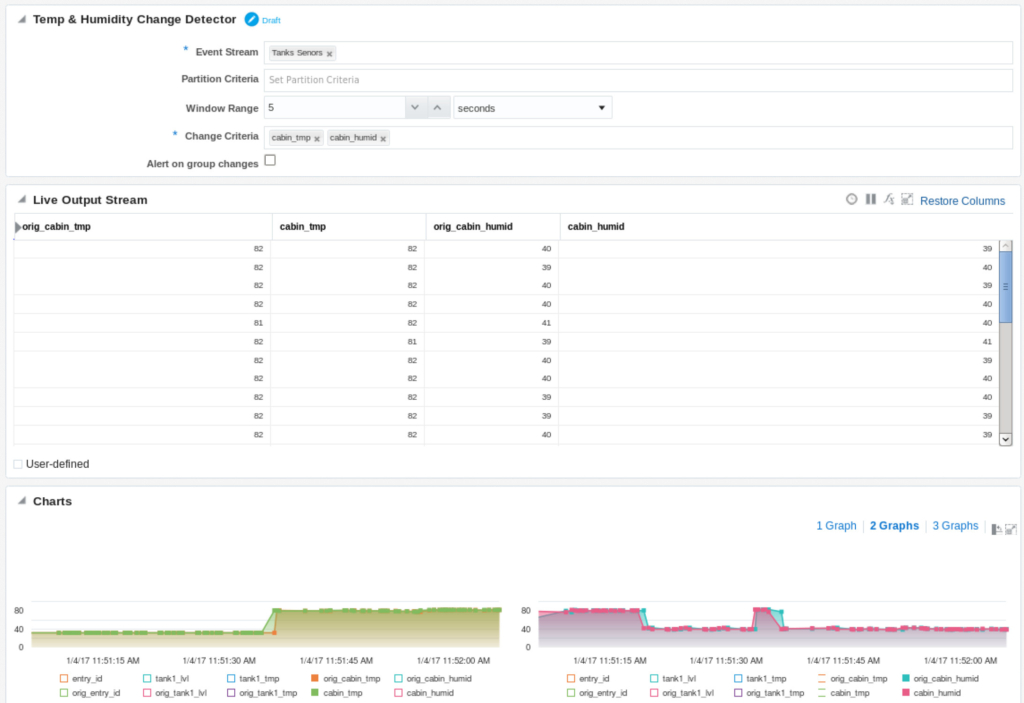
Temperature and Humidity Detector
This pattern will work on detecting any change in the temperature/humidity and send alerts. You may change the window range to specify how much time you can tolerate a change before making an alert notification.
Stream Aggregation
This exploration will run general AVG aggregation on different sensor data. You may use many aggregations in OSA, such as SUM, MIN, MAX and COUNT.
Trucks Tracking
The following spatial pattern will take care of truck tracking and alerting based on STAY/ENTER/NEAR/EXIT events in predefined geofences. You may design your own geofence zones, and give them labels to distinguish any event.
Here, the truck has left the base and drove through ROUTE 1.
The truck here has entered STOP #215 and stayed in it. This could be a “break” area to relax for drivers.
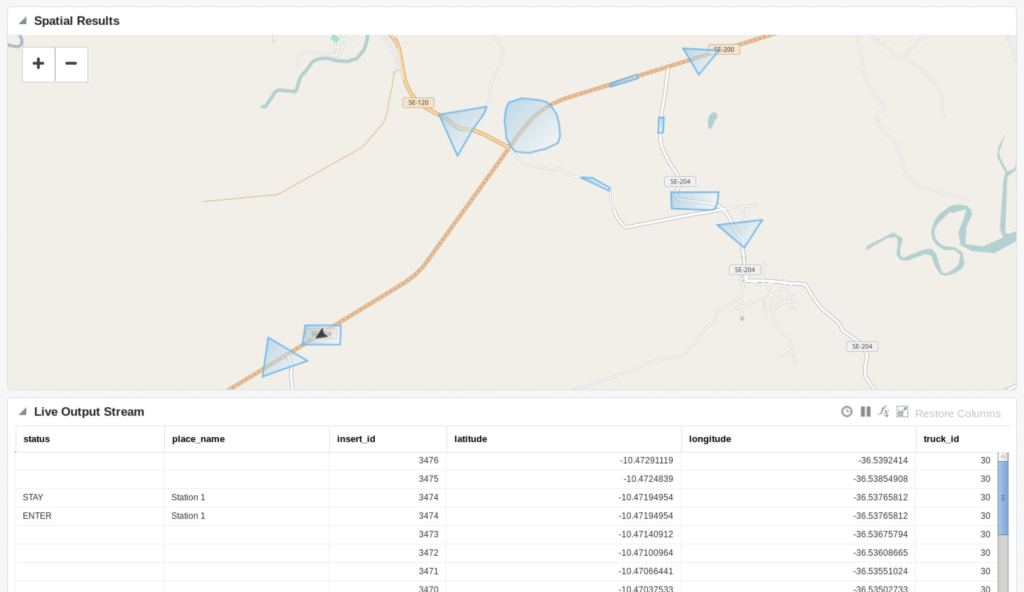
Here we can see that the truck has entered Station 1.
This whole trace was initiated by one of the sensors in one of the tanks in STATION 1 once it reached oil level under 15%. An alert, in the background, has been sent to the truck driver and request has been fulfilled.
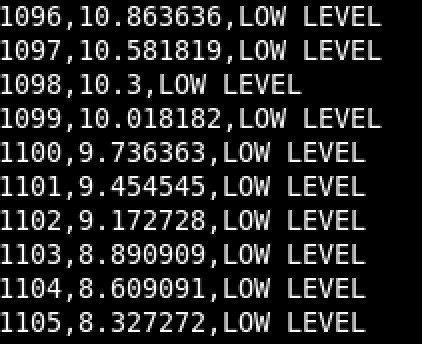
Here is a sample of the alerts sent, which can be processed by any external system, giving that OSA can export to many streaming channels.
Conclusion
IoT is something you need to capitalize on. The whole reason behind IoT is making dumb devices smarter, in order to enhance efficiency, productivity and customer experience.
The complexity of handling fast real-time data and analyzing it is something that can’t be ignored or underestimated. Therefore, having a solution like Oracle Stream Analytics makes the transition to IoT much more easier, scalable and flexible, without having you worry about “how to do it?”.
OSA is one solution that fits many purposes for engineering fast real-time data and applying complex data science, streaming, concepts effortlessly.