“The World Factbook provides information on the history, people, government, economy, geography, communications, transportation, military, and transnational issues for 267 world entities.” In this blog I’m going to work on dataset provided by the CIA, public information, and can be obtained from https://www.cia.gov/library/publications/the-world-factbook/
The data provided, which you’ll be able to download from my notebook, is in SQLite format which will give me the opportunity to show you how you can do SQL stuff in Python easily. In this exercise I was able to extract interesting information, like:
- Population Projection for all countries from 2020 until 2100. Here is an example for UAE, India and Japan:
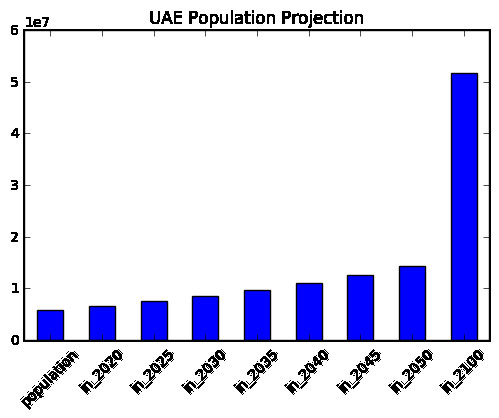
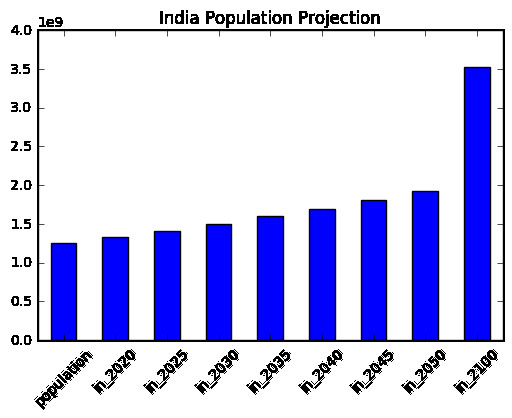
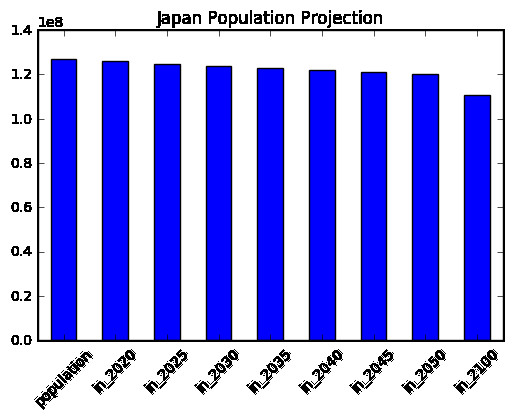
- Countries that will lose population over the next 35 years. Examples of those are Austria, Croatia, Germany, Japan (obviously from the preceding chart) and Ukraine.
- Russia has the lowest population density.
- Japan and Germany are among countries with highest population density.
- Pitcairn Islands has the lowest population in the world: only 48.
- Monaco has the lowest birth rate.
- Niger has the highest birth rate.
- Lesotho has the highest death rate.
- UAE, Qatar and Kuwait has the lowest death rate.
In my analysis, I’ve made use of the following python modules:
- Pandas
- sqlite3
- math
- matplotlib.pyplot
To make this more practical and realistic, I’ve edited my code in Jupyter notebook and uploaded it into my github repository. To access it, click here.
NOTE: github won’t display pretty page output if you’re on mobile. Please use either tablet/computer, or request “desktop” version on your mobile device.