Hacker News Data Analysis using Python

This is going to be a short and quick one before the weekend. I’ll be working with a dataset that has submissions to Hacker News from 2006 to 2015. Hacker News is a site where “users can submit articles from across the internet (usually about technology and startups), and others can “upvote” the articles, signifying […]
US Public Schools Civil Rights Data Analysis using Python

In this post I’m going to make some analysis on the 2013-14 Civil Rights Data Collection (CRDC). The CRDC is “a survey of all public schools and school districts in the United States. It measures student access to courses, programs, instructional and other staff, and resources — as well as school climate factors, such as […]
Star Wars Analytics using Python

Yes, you have read that correctly. In his post I’m going to clean up a dataset that has been collected from 835 people; a survey that has several questions around Star Wars 1 to 6. This will enable me to answer questions like “Does the rest of America realize that “The Empire Strikes Back” is […]
Cleaning, Enriching, Analyzing & Visualizing NYC High School Data using Python

Data preparation is a very important step in any data analysis/science project, it enables us to do proper analysis and visualization in order to come up with answers to questions that we propose. In this post, I’ll show you how I cleaned and enriched a dataset for NYC High School Data. The datasets used can […]
Visualizing The Gender Gap In College Degrees with Python

In this post, I’ll show a visualization that I’ve created using Python for the gender gap across college degrees between 1970 and 2012 in the USA. The dataset used contains the percentage of bachelor’s degrees granted to women for that period, and is made available, publicly, by The Department of Education Statistics. While the visualization […]
Analyzing Thanksgiving Dinner with Python

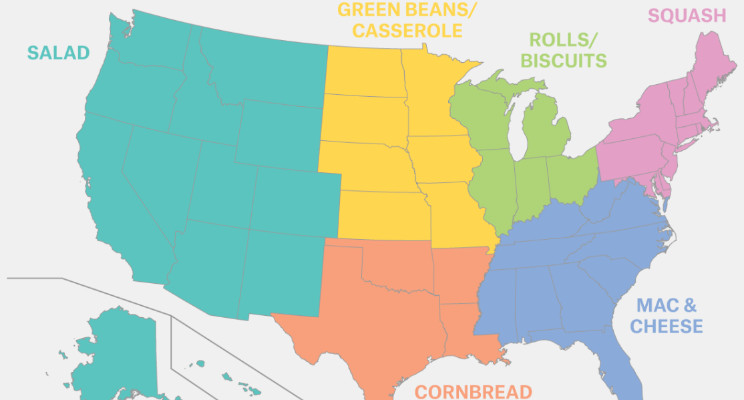
In this post, I’m going to analyze Thanksgiving dinner in the US using python by working on a dataset that contains 1058 responses to an online survey about what Americans eat for Thanksgiving dinner. That dataset contains 65 columns, and 1058 rows. Most of the column names are questions, and most of the column values […]