In this post I’m going to make some analysis on the 2013-14 Civil Rights Data Collection (CRDC). The CRDC is “a survey of all public schools and school districts in the United States. It measures student access to courses, programs, instructional and other staff, and resources — as well as school climate factors, such as student discipline and bullying and harassment — that impact education equity and opportunity for students.
The datasets consist of 1,929 columns and 95,507 rows, reflecting:
- Number of school districts: 16,758 (99.2% of all school districts)
- Number of schools: 95,507 (99.5% of all public schools)
- Total number of students: 50,035,744
From the dataset, for instance, you’ll be able to calculate the percentage of a certain race/ethnicity in magnet schools across the country. Due to the large nature of the datasets, and the vast amount of information available, I’ve only done some analysis on selected subjects as part of my “python exercise” for data analysis/science. The documentation for this “magnificent” dataset can be found here. And you may download the dataset and dictionary files from here, if you wish to practice it yourself.
To make this more practical and realistic, I’ve edited my code in Jupyter notebook and uploaded it into my github repository. To access it, click here.
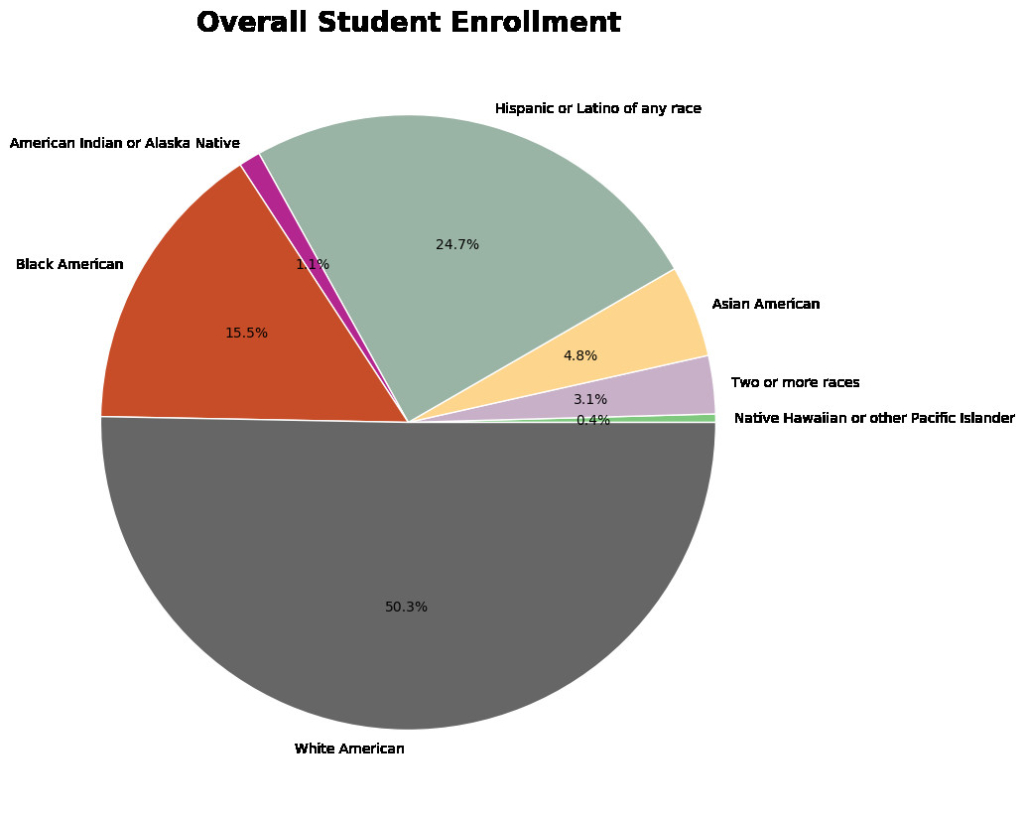
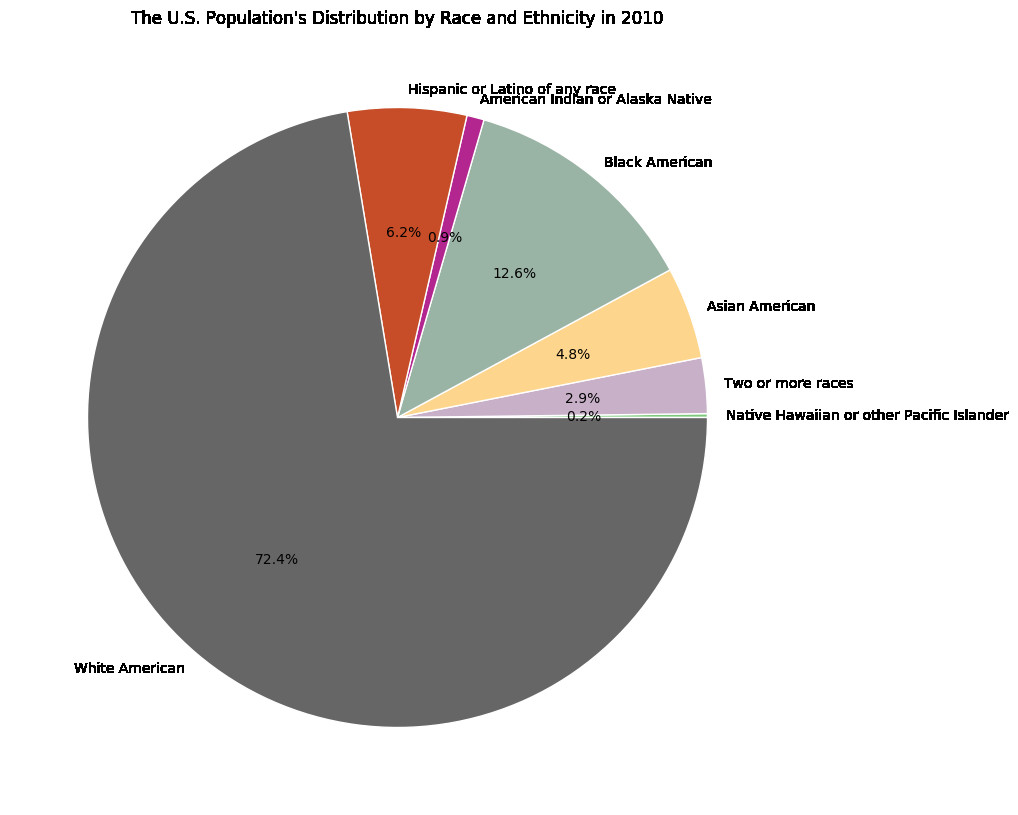
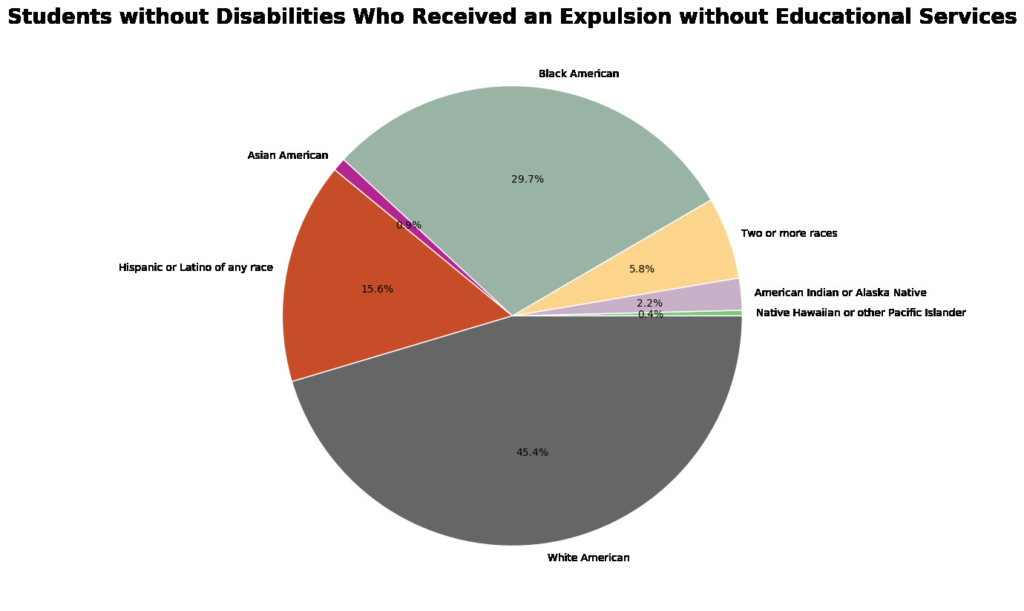
Here are few examples of the visualizations created:
To access the full analysis code and visualizations, click here.
NOTE: github won’t display pretty page output if you’re on mobile. Please use either tablet/computer, or request “desktop” version on your mobile device.