Cleaning, Enriching, Analyzing & Visualizing NYC High School Data using Python

Data preparation is a very important step in any data analysis/science project, it enables us to do proper analysis and visualization in order to come up with answers to questions that we propose. In this post, I’ll show you how I cleaned and enriched a dataset for NYC High School Data. The datasets used can […]
Visualizing The Gender Gap In College Degrees with Python
In this post, I’ll show a visualization that I’ve created using Python for the gender gap across college degrees between 1970 and 2012 in the USA. The dataset used contains the percentage of bachelor’s degrees granted to women for that period, and is made available, publicly, by The Department of Education Statistics. While the visualization […]
Analyzing Thanksgiving Dinner with Python
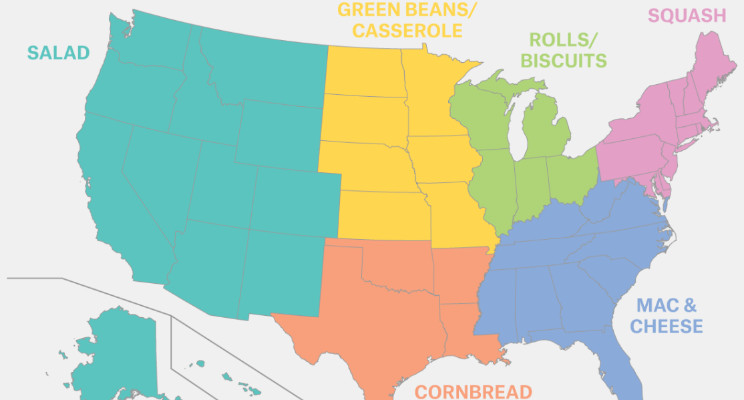
In this post, I’m going to analyze Thanksgiving dinner in the US using python by working on a dataset that contains 1058 responses to an online survey about what Americans eat for Thanksgiving dinner. That dataset contains 65 columns, and 1058 rows. Most of the column names are questions, and most of the column values […]
Visualizing with Python: Earnings Based On College Majors

In this post, I’m going to show you a python script that visualizes dataset in order to answer specific questions. Something that you’d do as a data analyst or data scientist very often. While this is not an advanced topic, it should give you an idea of how to get things done using Python. NOTE: […]