After the successful experiment of harvesting Big Data in my last OEMM article, I wanted to see the possibility of harvesting a Cloud-based database and run some data lineage and impact analysis.
This article aims to show you the cloud-readiness of OEMM and its heterogeneity to work with other vendor’s integration and reporting tools. As the Big Data experiment, it’s more of “what can be done” rather than “how it can be done”.
Ingredients
My Oracle Linux 7 machine
Oracle VirtualBox
My customized OEMM VM, running OEMM version 12.1.3.0.1, having:
- Microsoft SQL Server 2014 Enterprise Edition
- Microsoft SQL Server Integration Services 2014
- Microsoft SQL Server Analysis Services 2014
- Microsoft SQL Server BI & Reporting Services 2014
- Microsoft Visual Studio 2012
Microsoft Azure SQL Database (on Microsoft’s Cloud)
Scenario
In this experiment, I’ve used Microsoft’s sample database AdventureWorks , an online transaction processing (OLTP) database. The AdventureWorks Database supports a fictitious, multinational manufacturing company called Adventure Works Cycles. For the purpose of this experiment, I’ve used the Azure SQL version of this database, which means the OLTP database is running on the Cloud, Microsoft’s cloud.
As usual, to make my life harder, I’ve decided to do some integration work. This time, I used a non-Oracle tool that I have no experience with, SSIS. I’ve used some sample DW refreshing job, which basically creates the needed dimension and fact tables in a local MS SQL database.
After that, I’ve continued on making my life even harder by designing some MS BI report. To do that, I had to use MS Server Analysis, BI and reporting services. Not a fun job for an integration person like me, and an Oracle one, who also has no experience in using any of those tools. But a challenge is a challenge.
The flow of data is:
MS Azure SQL (cloud OLTP) -> SSIS (ETL) -> Local DW DB -> Analysis (creating cubes, etc…) -> Visual Reports
The Execution
Step 1
This step involves preparing all the requirements I needed to execute this experiment. That involves creating MS Azure Cloud account, installing all those Microsoft products I’ve mentioned before on my VM, configure them, suffer, learn how to do all that and finally have my raw databases ready for integration.
Since this article is more about OEMM, and showing what can be done, I’ll not go through the steps I’ve taken. But I’ll share with you how things eventually looked like.
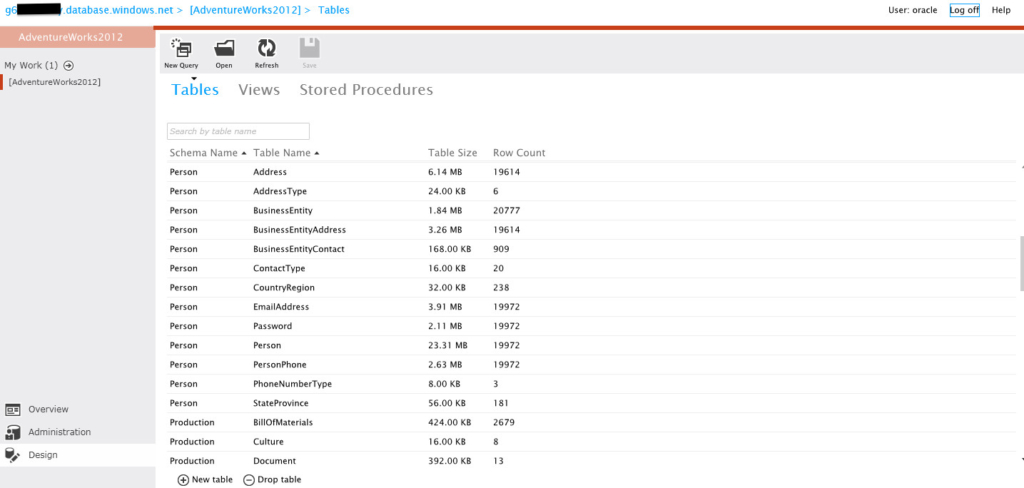
On Microsoft Azure SQL online account, the AdventureWorks OLTP looks something like this:
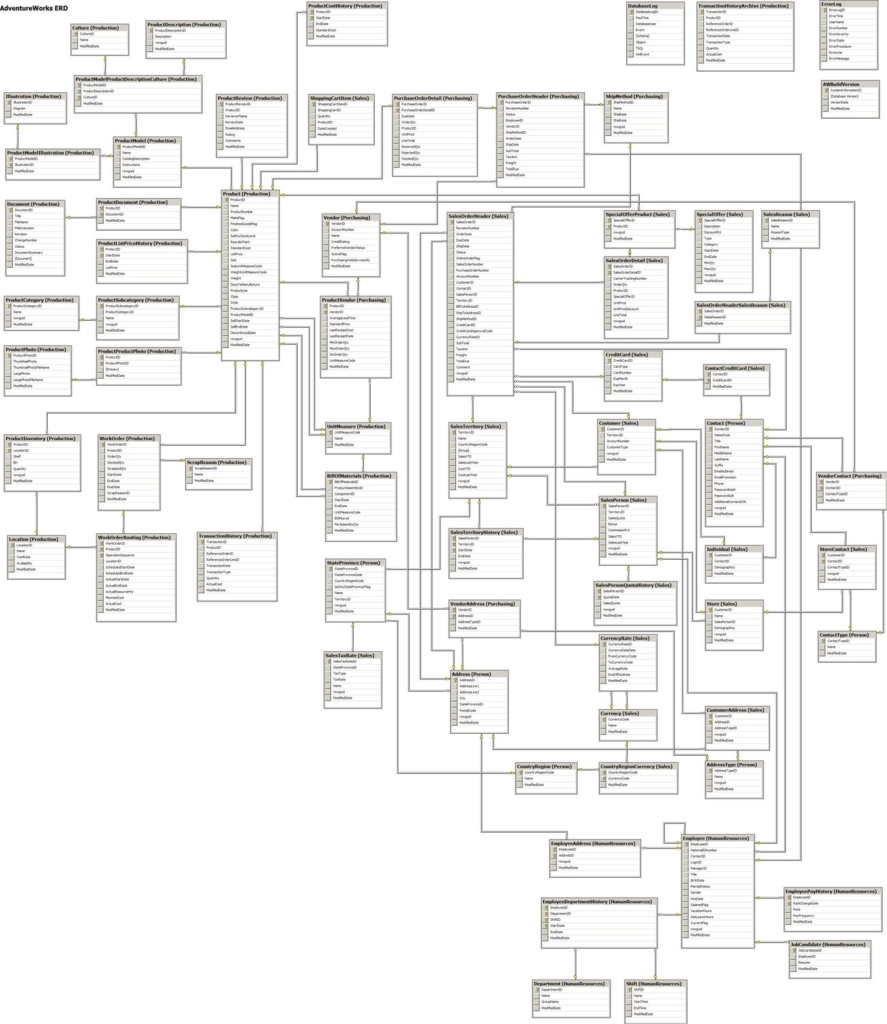
The ERD Diagram for this OLTP database:
Step 2
This is the step where I thought the rest is going to be like a walk in the park. As I’ve mentioned in my scenario earlier, I wanted to make things a bit more challenging by using some non-Oracle integration tool to move/transform data from the Cloud OLTP to a local data warehouse. That is, from Azure SQL Database (online Cloud) to MS SQL Server 2014 on my VM. Regardless of the limitations, Microsoft cloud has which made my life harder, I’ve managed to have this done.
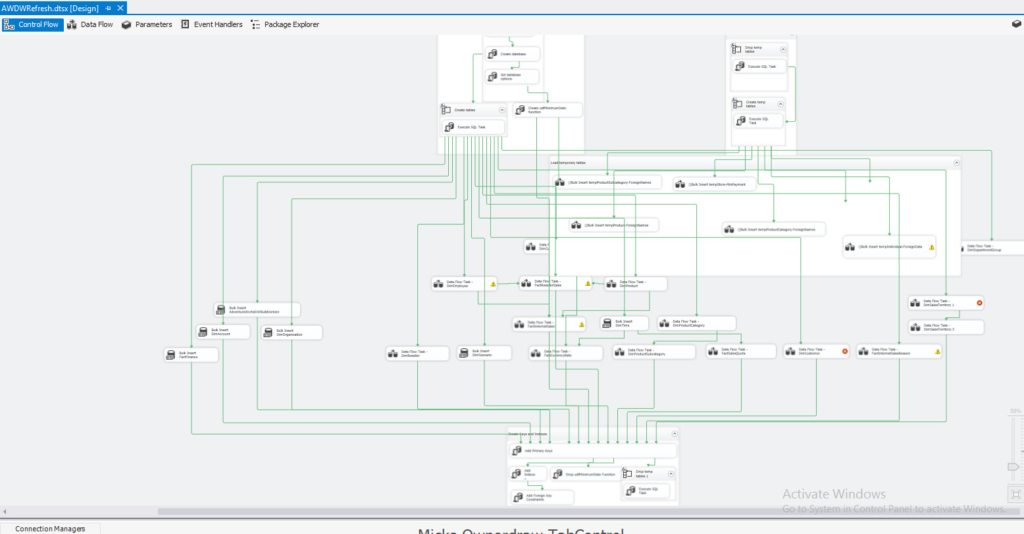
The ETL job is implemented using SSIS, and basically, it refreshes a local data warehouse for AdventureWorks (creating dimension, fact tables, etc…). The job design looks something like this:
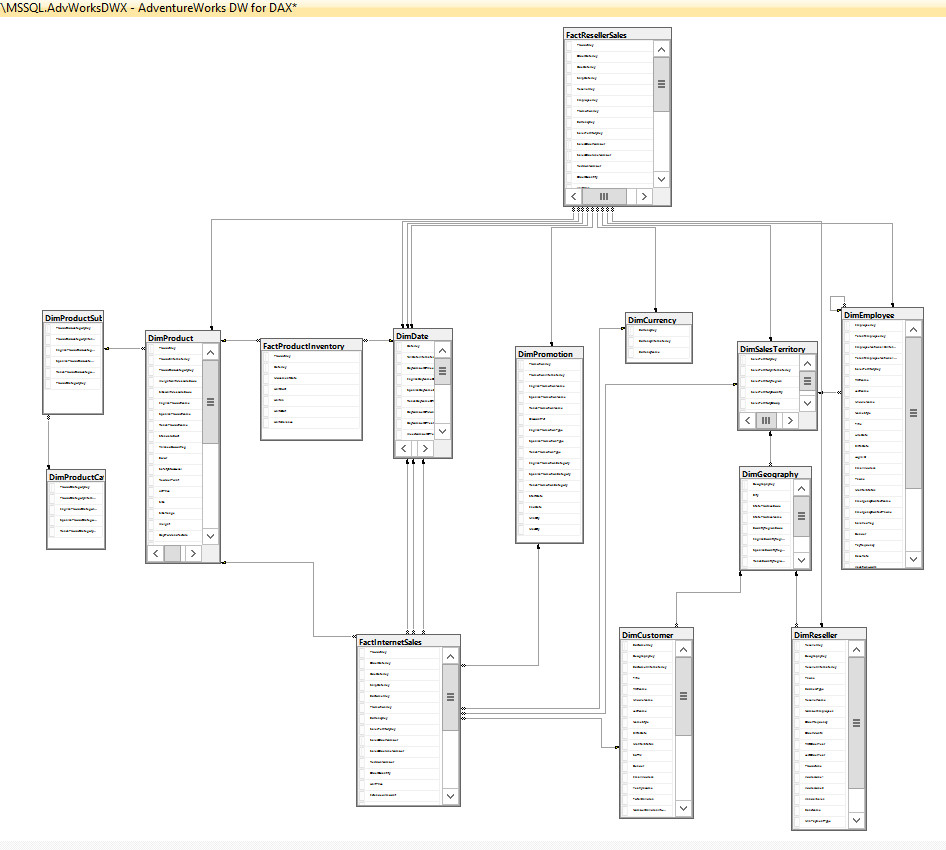
Once I ran this job, my local DW on MS SQL Server looked something like the following:
So now my local DW looks good, time to design some analysis. I’ve used MS Visual Studio to customize my “dimensions” and “mining” structured analysis, making cubes look like the following:
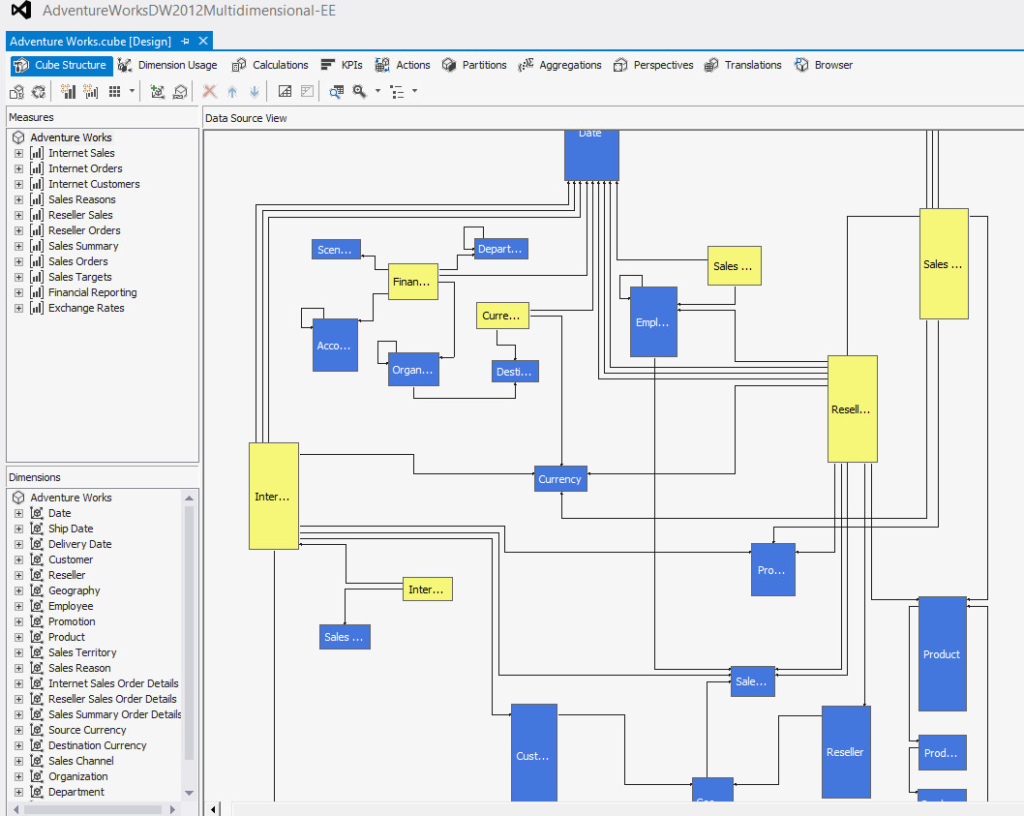
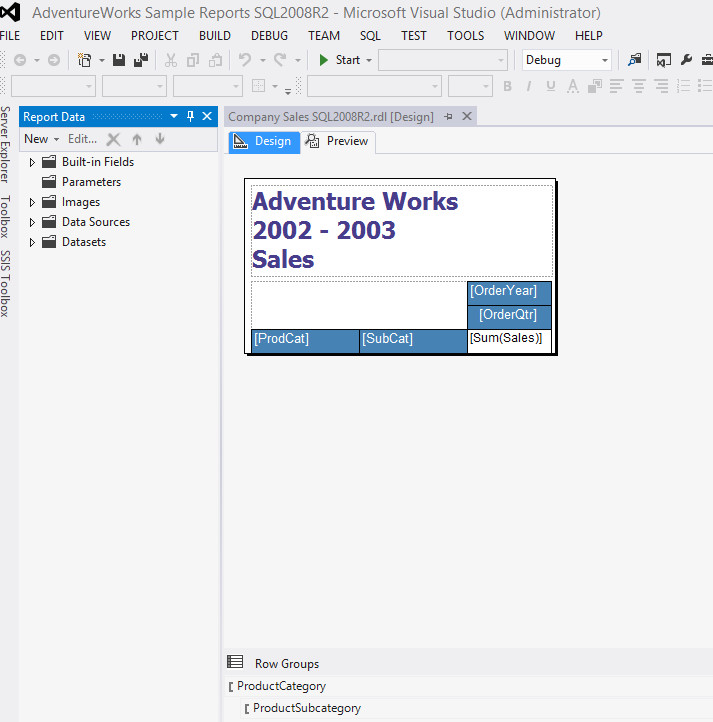
Having the analysis designed, I’ve deployed it on MS SQL Server Analysis Services and started to customize my visual reports using Visual Studio. Design time looked something like the following:
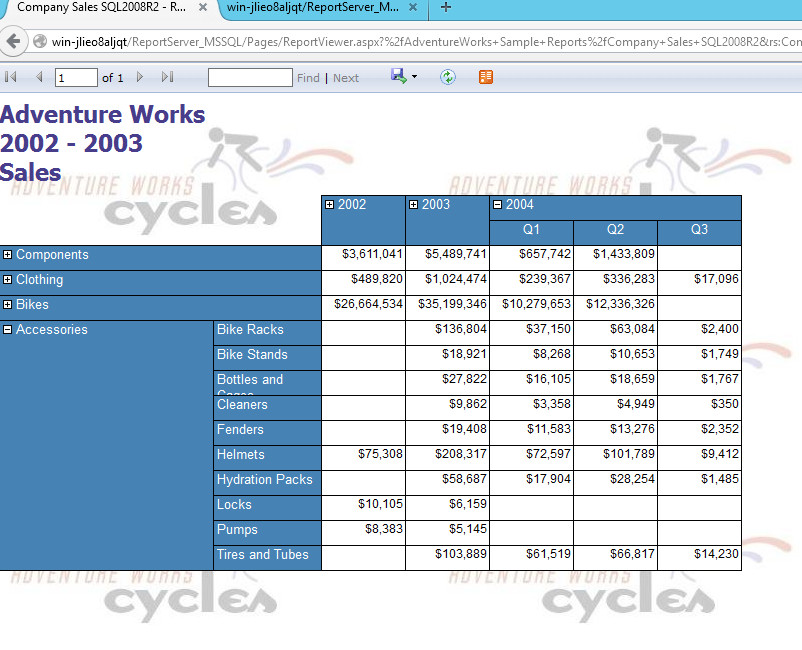
Also, I had to deploy the preceding on MS SQL Server and link it with the Analysis Services. Once I was done, I could see the report via browser:
Having all the preceding done, it was time to jump into OEMM and see how we can harvest all these sources, “stitch” them and do the lineage/impact analysis. It should be interesting after all to see a cloud lineage, no?
Step 3 (A)
I updated my OEMM to the latest release at the time of writing this article, and that is 12.1.3.0.1. If you read my previous two articles, Big Data & OEMM and OEMM Overview, you’ll notice a slight difference in the UI. Now let’s get to the action.
I created a folder in my OEMM Repository called “Cloud Experiment” to keep things organized. Then I started creating models connecting to my sources and harvesting them.
Azure Cloud Model
While this was supposed to be the tricky one, it wasn’t at all. I connected to the Azure SQL database using ODBC and in OEMM the configuration was:
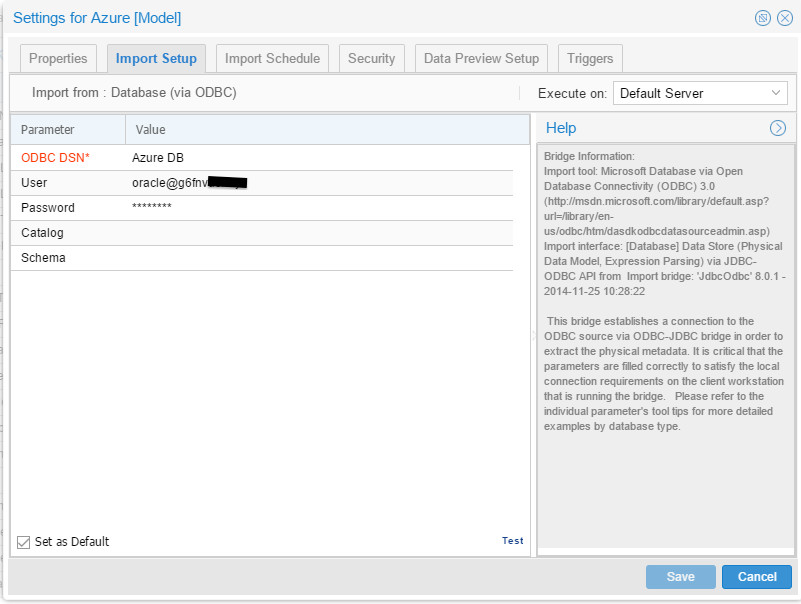
And the harvested model was in OEMM right after:
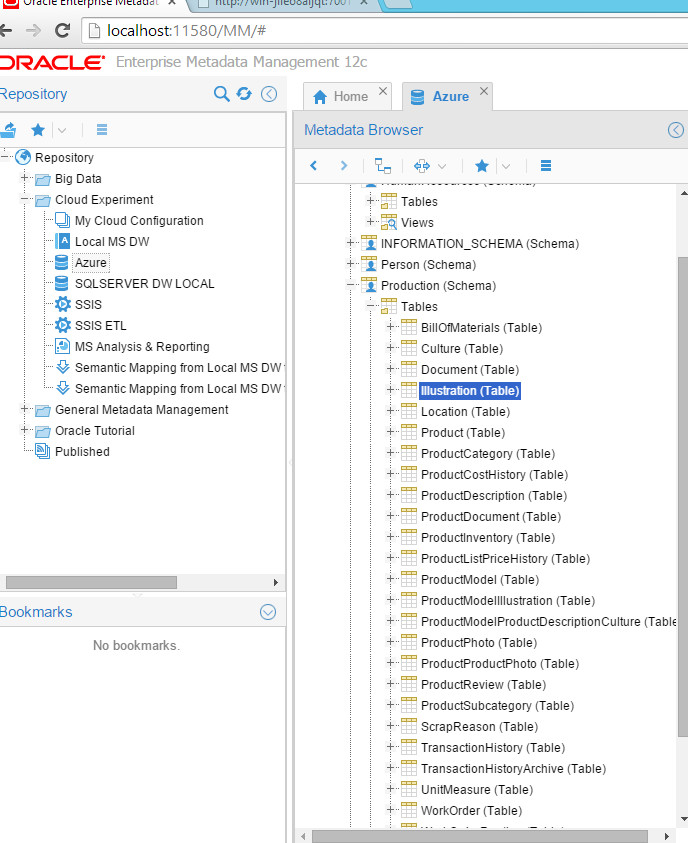
Yes, we have just harvested a cloud database.
SQL Server DW Local
For this one, I’ve used native Microsoft SQL Server JDBC, the configuration was very simple:
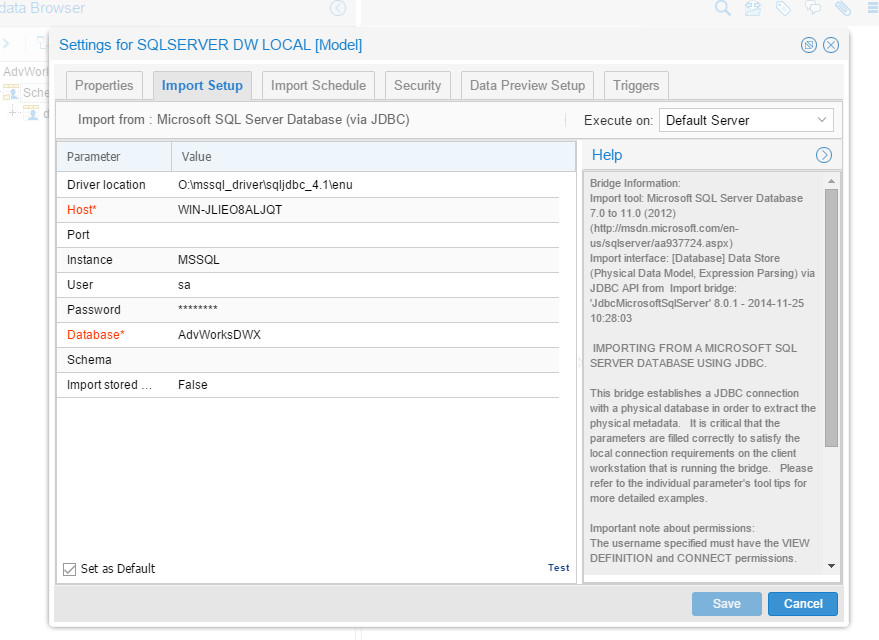
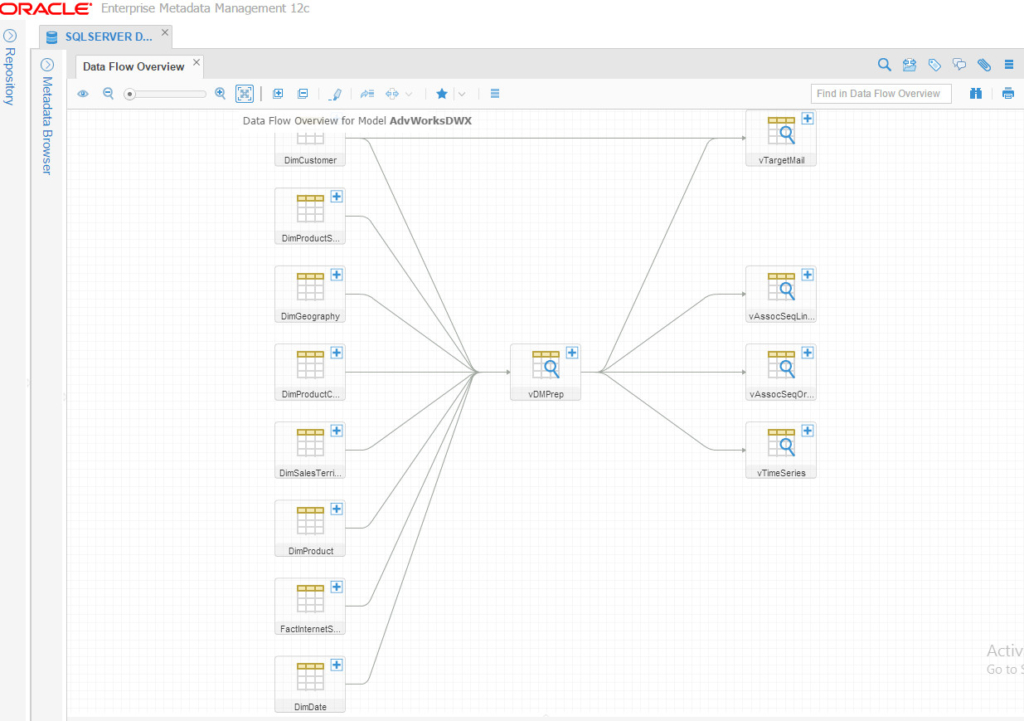
And resulted in the following harvested model:
SSIS Model
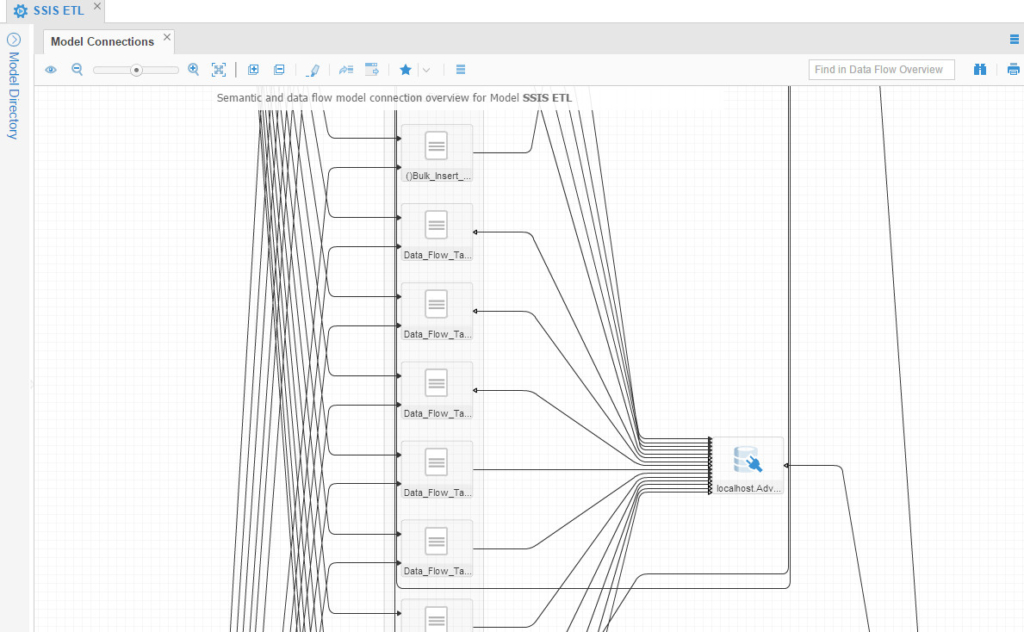
Due to the nature SSIS implement jobs in one big container, it becomes a bit hard to overlook everything because it’s all in one place/diagram. Anyway, this is a zoomed-in portion of how it looks like:
MS Analysis & Reporting Model
Finally, the last model to harvest. The configuration of this model is a bit unusual due to the architecture Microsoft has made. We need to point to the Analysis Server instance and the reporting Server as well:
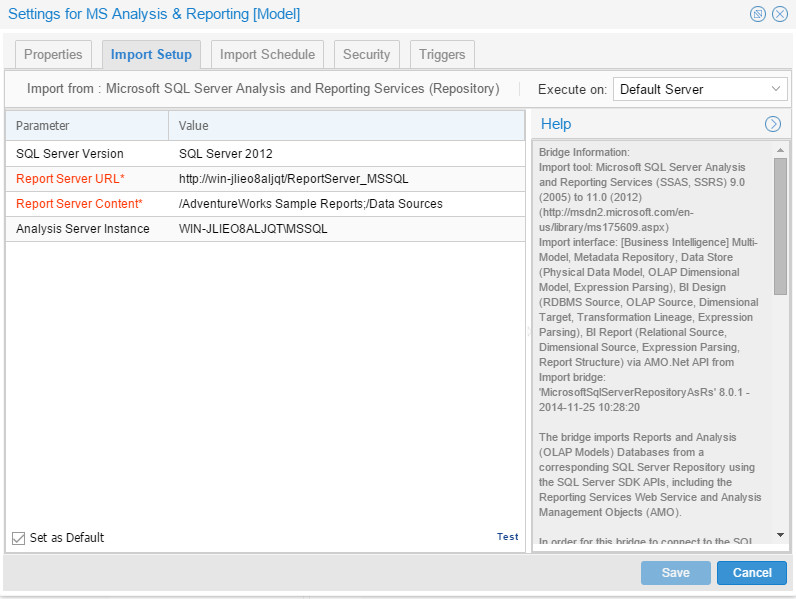
Note that in OEMM, we can harvest directly from online repositories and also via export files. You may find many bridges for different technologies using different methods to access your infrastructures’ metadata. Anyway, the harvested metadata diagram looked like this:
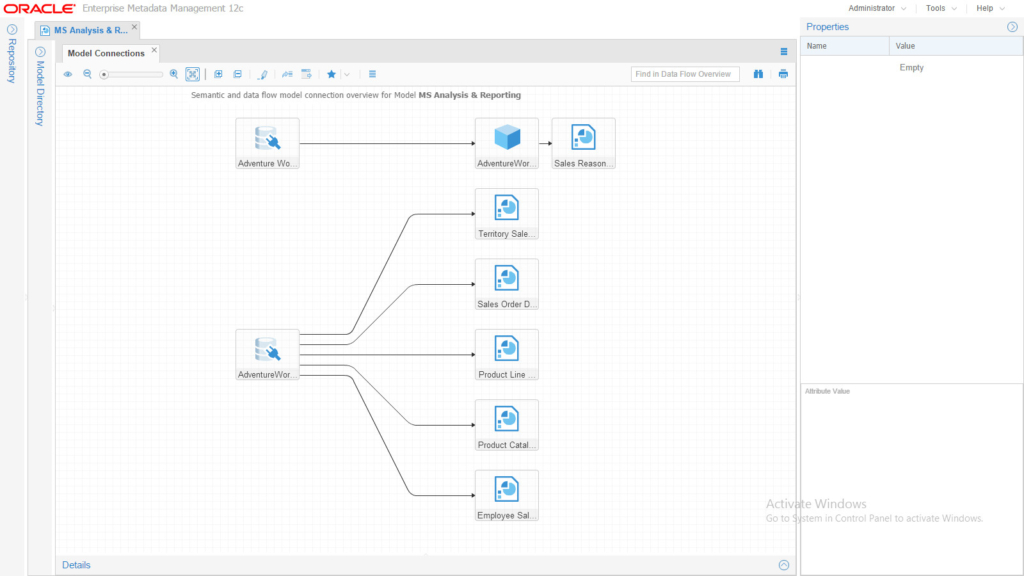
Simple, neat and clean.
Step 3 (B)
Now all my sources have been harvested, it’s time to put them together in one “Configuration” and “stitch” them. A fairly simple process involves only drag/drop and “Validation” to produce the following Architecture Diagram:
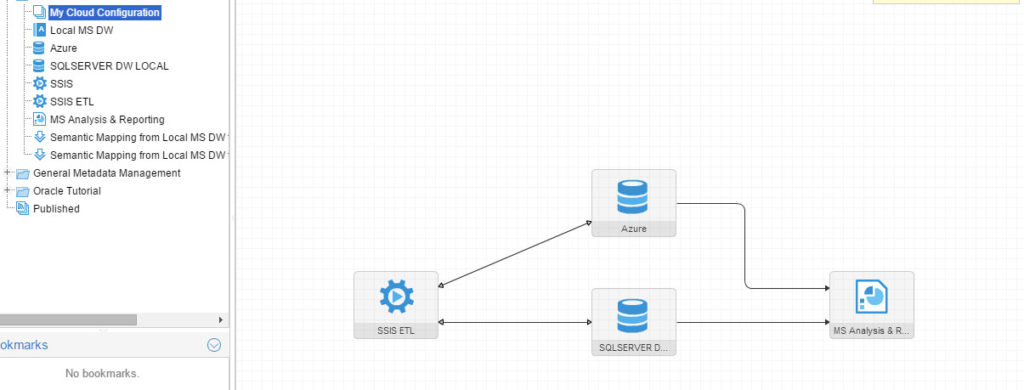
Now that we have our cloud OTLP harvested and stitched with the local integration tool, database and reporting services, let’s run some lineage analysis. I’ll go to the “Company Sales report” which I showed earlier in the browser:
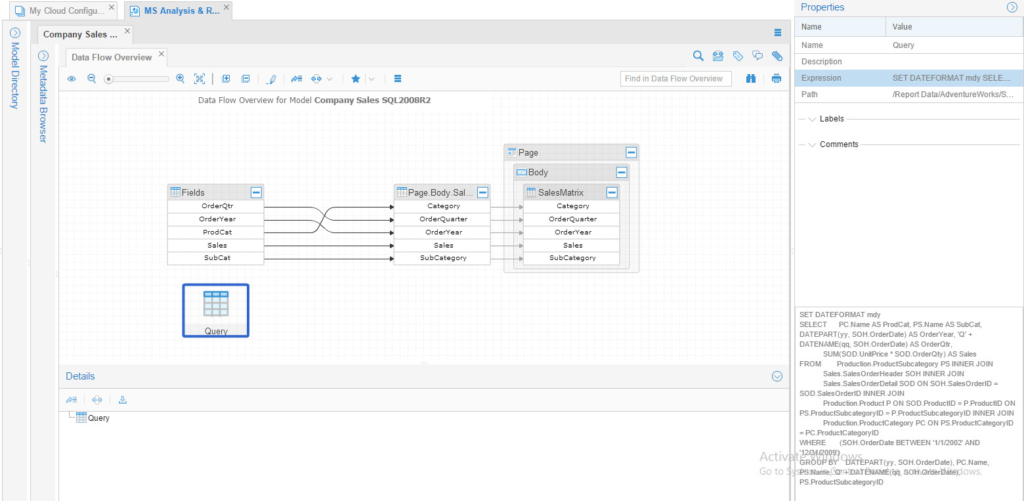
Notice that I’m selecting the “Query” node and able to see its expression on the right pane. Let’s run Lineage Analysis on one of the charts in the reports, the “Top Employee” chart, which is part of the “Product Line Sales” report. Note that this chart takes the data directly from the OLTP database, Azure cloud database:
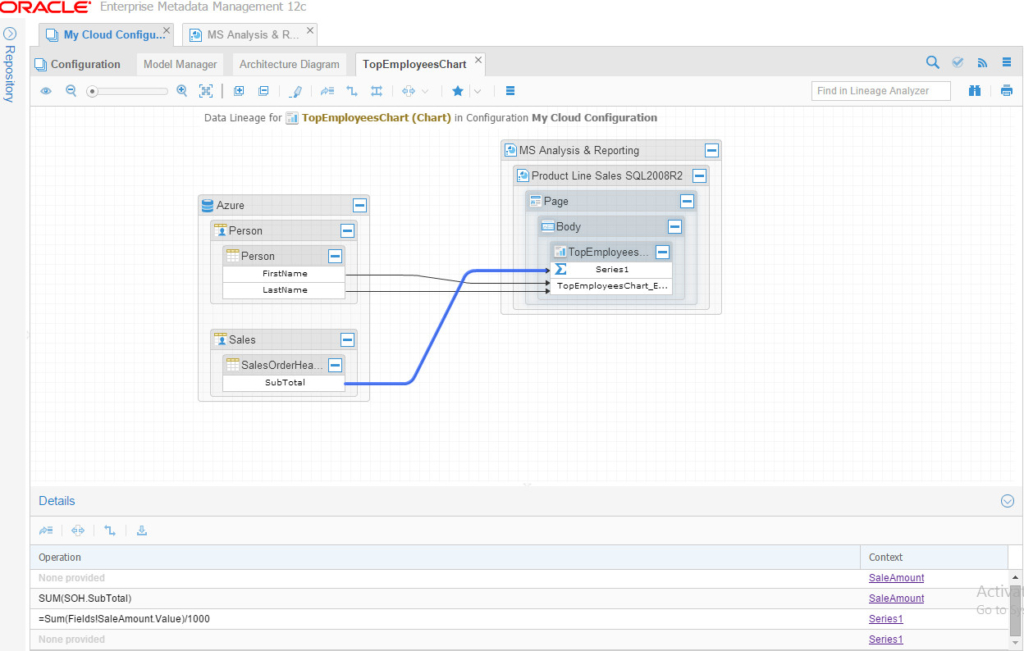
And by selecting the path leading to “Series1”, I could see all the operations happening. How about running a Lineage on something that is populated on our Data Warehouse (via SSIS)? For this purpose, we’ll be using the “Sales Reason Comparison” report, and trace the Data Lineage for the matrix:
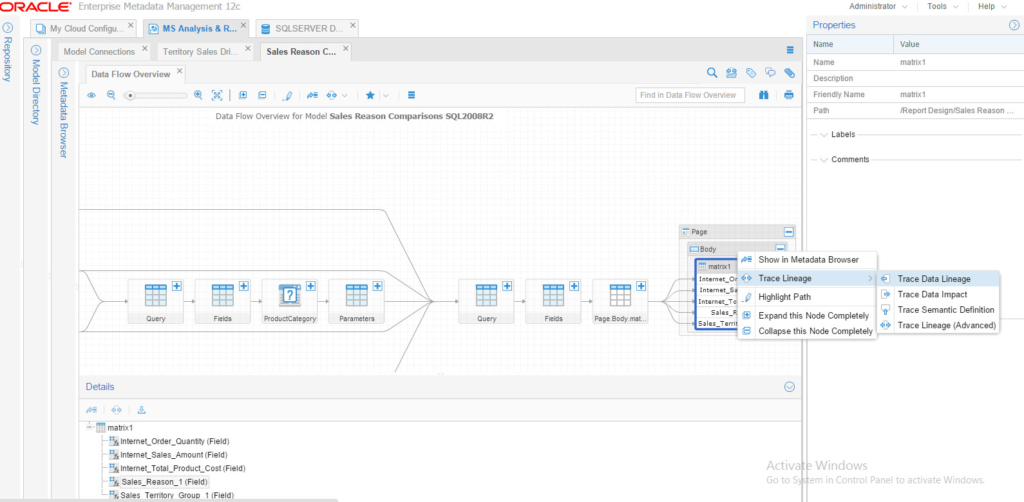
And the result is the following beautiful linage full trace:
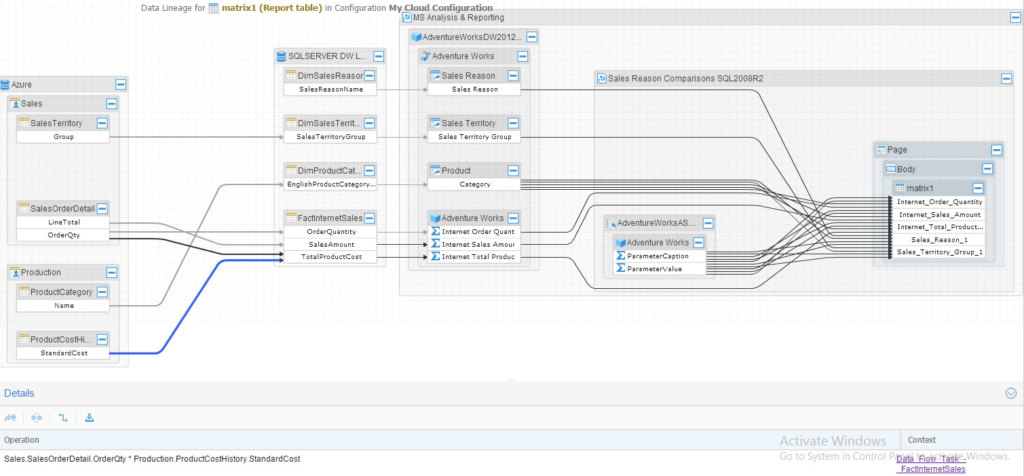
Notice that I clicked on the arrow (the blue one) from Azure database that points to the “StandardCost” column on the data warehouse table, and at the bottom, there are details of the operation (the ETL). If you want to trace it and see what’s happening inside that ETL you could easily right-click and choose “Trace ETL Details”.
Ok, now we’ve done some Lineage Analysis, how about an Impact Analysis? Let’s go to our Cloud-based database, Azure SQL, and trace data impact for the table “SalesTerritory”:

Beautiful, isn’t it? Full impact analysis from our Cloud harvested model, all the way to our locally created MS BI report. And as usual, you may click on any path to see details behind any ETL that leads to the DW, for instance.
The last thing I needed to check is to have a business glossary built from my data warehouse and cloud. I’ve done that by simply drag/drop my Azure Model and SQL SERVER DW LOCAL model into an empty Business Glossary, resulting in:
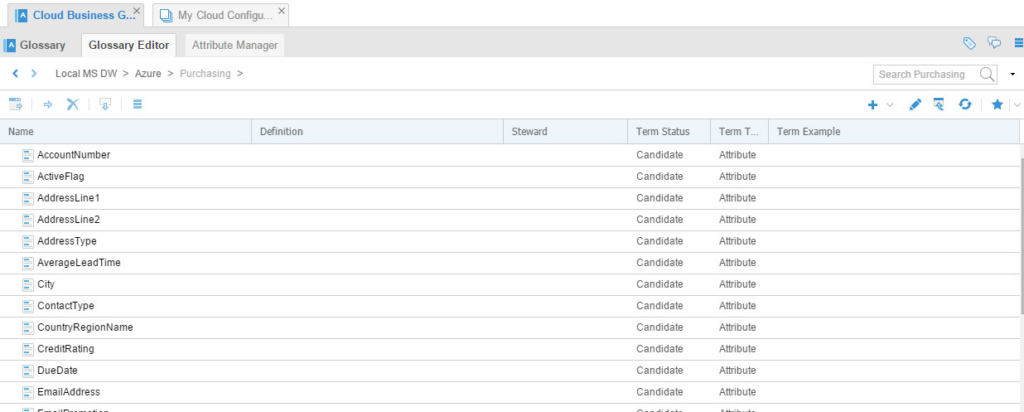
Conclusion
OEMM is a cloud-ready solution. I could harvest the Azure SQL database like any other local model, “stitch” it with an integration tool (SSIS) and MS BI reports. I was also able to build a business glossary from the Azure SQL database easily. This experiment proves not only the ability of OEMM to manage Cloud-based sources metadata but also the heterogeneity of the solution to work with non-Oracle technologies.
Having an Enterprise Metadata Management solution is a must to any organization seeking data governance, reducing risks and ensuring data quality across all processes.